Mortgage Amortization Calculator: Loan Schedule & Payment Details
The Mortgage Payment Calculator offers a powerful tool for understanding your mortgage's financial journey. By using our Mortgage Amortization Calculator, homebuyers and current homeowners can effortlessly estimate monthly payments, generate a detailed amortization schedule, and analyze the distribution of principal and interest across the loan term. View your remaining loan balance at any point, explore how additional principal payments might shorten your loan duration, and compare various loan terms to make informed decisions about your home financing options. Empower yourself with clear insights into your mortgage repayment strategy today.
Enter Mortgage Details
Estimates only; taxes, insurance, and HOA are shown as level monthly averages for illustration. Bi-weekly is simulated as about one extra monthly payment per year.
Amortization Results Summary
Get Pre-Approved Based on Your Scenario
Now that you’ve mapped out your payoff path, take the next step. See if you qualify for a home loan with these numbers and get personalized rate options from trusted lenders in minutes.
Brief Overview
The Mortgage Amortization Calculator is an invaluable tool for understanding your mortgage's financial dynamics, enabling you to estimate monthly payments and generate a detailed amortization schedule. By analyzing how each payment is divided between principal and interest, you can visualize your loan balance over time and evaluate the impact of extra principal payments. This tool is essential for homebuyers, current homeowners, and investors to make informed decisions about refinancing options, loan terms, and loan payoff strategies. Utilize these insights to effectively manage your mortgage, optimize home equity, and achieve long-term financial objectives with confidence.
Key Highlights
- Mortgage Amortization Calculator helps visualize payment breakdown and manage home loans effectively.
- Extra principal payments reduce interest costs and accelerate loan payoff.
- Interest rate and loan term significantly influence total mortgage costs.
- Comparing different loan scenarios aids in making strategic finance decisions.
- Understanding mortgage amortization empowers informed decisions, optimizing financial health.
Understanding Mortgage Amortization
Mortgage amortization involves the systematic breakdown of each mortgage payment, allowing you to see how much goes toward interest and how much reduces the principal of your loan amount. With varying loan terms, a mortgage amortization schedule helps you determine the monthly payment structure over the life of the loan. Early in the loan term, a large part of your monthly payment covers interest due to the high principal balance. Over time, as you continue these scheduled payments and the principal decreases, the interest portion drops, and more of each payment goes toward reducing the loan amount. By using an amortization calculator, you can perform detailed amortization calculations to explore how extra principal payments can dramatically affect your mortgage payment outcome and long-term interest savings. Understanding your schedule provides insights for strategic decisions like when to refinance, how to manage loans effectively, and ways to build home equity faster. Equity accounts grow as the principal decreases, offering you more financial flexibility. By accurately comprehending mortgage amortization, you’re better informed to visualize your mortgage over time and make smart choices tailored to your financial objectives, equipping you to manage loans strategically.
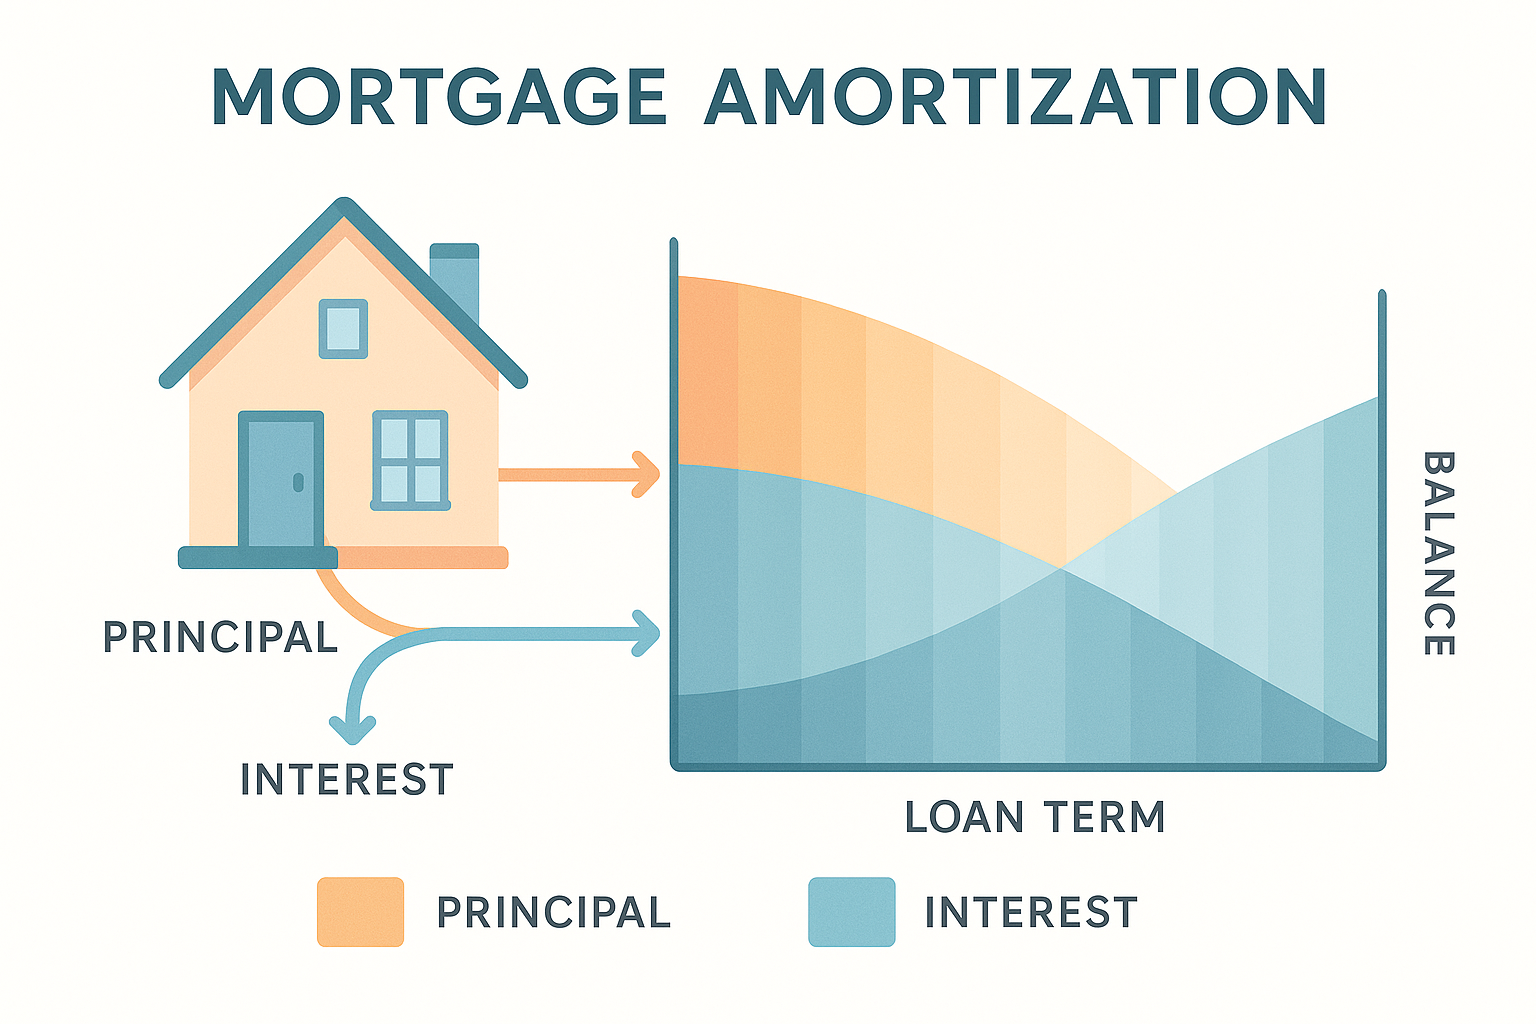
What is an Amortization Schedule?
An amortization schedule is an essential tool for understanding your mortgage loan's repayment process. This schedule outlines how your loan amount is paid off over time, breaking down each payment into specific portions of principal and interest. With amortization calculations, borrowers can accurately see how much of their mortgage payment goes toward reducing the loan principal and how much is allocated to interest costs. By analyzing your amortization schedule, you gain insights into how quickly you're building equity in your home and how much you'll pay in interest over the life of the loan term. Early in the schedule, a larger portion of each payment is dedicated to interest; as time progresses, more of each payment contributes to lowering your loan principal. Understanding this schedule empowers borrowers to make informed decisions about refinancing, making extra principal payments, or adjusting their loan terms. With our Mortgage Payment Calculator, you can easily create and analyze your mortgage amortization schedule, giving you full visibility into each payment's breakdown and helping you strategize your home financing. It's a proactive approach to managing your mortgage loan, ensuring you're well-prepared for the financial journey ahead.
How an Amortization Calculator Works
Understanding how an amortization calculator functions is crucial for effectively managing your mortgage. A mortgage calculator specifically designed for amortization enables you to comprehend the breakdown between principal and interest in each payment over your loan's lifespan. The amortization calculator provides a comprehensive mortgage amortization schedule, outlining how your monthly payment contributes to decreasing your principal while covering the interest rate. During the early stages of your loan, a significant portion of each payment is dedicated to interest. As the years progress, more of your monthly payment will be applied toward reducing the principal. By using a mortgage calculator focusing on mortgage amortization, you gain insights into how changes in your interest rate impact the overall costs. The calculator also allows you to test various scenarios, such as reducing loan terms or making extra principal payments, which can accelerate your loan payoff and decrease interest expenses. Such insights make the amortization calculator an indispensable tool for refining your mortgage strategy, empowering you to make informed decisions whether you're planning to refinance, preparing for an early payoff, or evaluating the benefits of adjusting loan terms. Leverage the calculator to visualize your financial journey and refine your approach to home financing.
Using the Mortgage Amortization Calculator
The Mortgage Payment Calculator is designed to make it easier to understand your mortgage amortization process. By using this mortgage calculator, you can easily determine how each payment impacts your loan principal. The detailed breakdown shows how much of each payment goes toward interest and home equity, helping you visualize your loan's progress over time. This amortization calculator helps you understand the long-term cost of your mortgage and is invaluable for anyone considering refinance options to take advantage of favorable refinance rates. One of the great advantages is you can compare different loans and loan terms to find the best option for you. Whether you're looking at 15-year or 30-year scenarios, this tool provides clarity. With accurate amortization calculations, you gain insight into potential savings through extra principal payments. Calculators like these are essential for staying informed and making educated financial decisions about your mortgage. You can explore different strategies for managing your loan along with benefits like shortened payoff timelines. In short, our calculator empowers you to ask the right questions when consulting with lenders and to make well-informed decisions regarding your home financing.
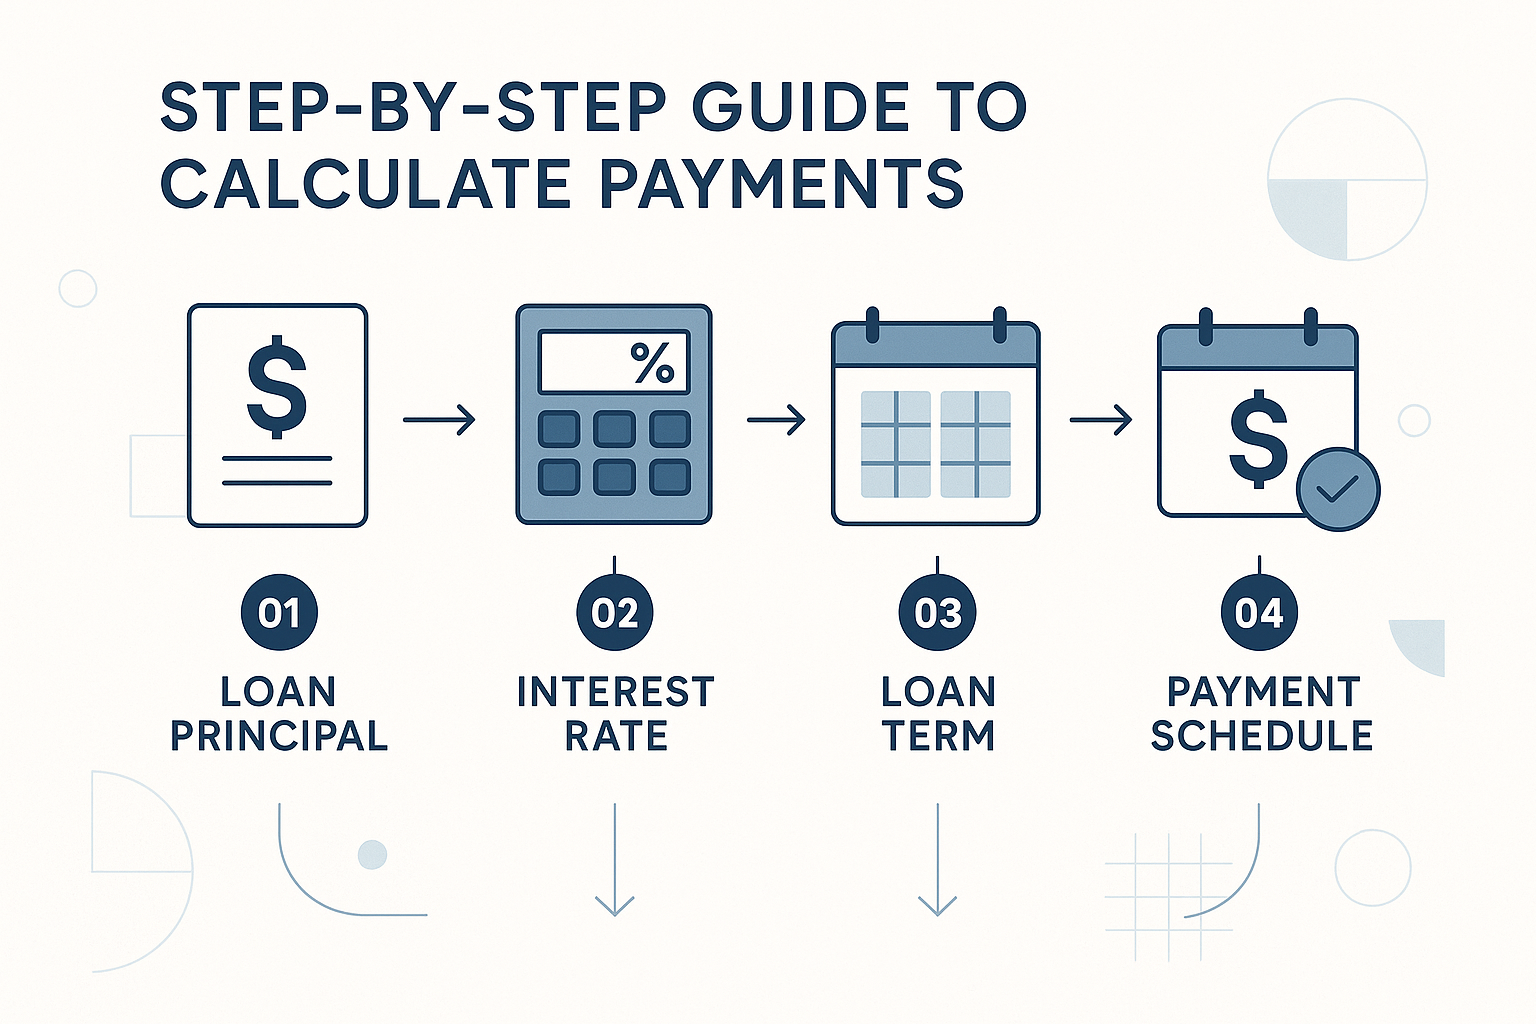
Step-by-Step Guide to Calculate Payments
Understanding how to calculate your monthly payment accurately is crucial for effective mortgage management. First, gather essential details such as the total loan amount, loan term, and interest rate. These components determine the core structure of your mortgage loan. To begin, use our reliable amortization calculator to input the loan amount you're borrowing. Next, select the loan term, which is the duration over which you'll repay your mortgage. Common loan terms are 15-year and 30-year options. Enter the interest rate, a vital factor that impacts your mortgage payment significantly. Once all fields are filled, the amortization calculator will process and display your monthly payment and provide a detailed loan schedule. This schedule showcases how much of each monthly payment goes toward principal and interest over time. If you're considering refinancing or paying extra principal, our calculator allows you to simulate different scenarios, helping you determine the most cost-effective strategy. By understanding this process, you'll gain insights into how principal, interest rate, and loan term interact, empowering you to make informed decisions. Utilize this step-by-step guide to optimize your mortgage payments, manage loans efficiently, and achieve your home financing goals.
Visualizing Your Mortgage Over Time
Understanding how your mortgage evolves over time is crucial for effective financial planning. By examining an amortization schedule, you can see clearly how each payment is allocated to principal and interest throughout the loan term. Early in the process, fixed mortgage payments work by directing a larger portion toward interest, gradually shifting to reduce the principal balance more significantly. This visibility into your mortgage enables you to appreciate the progression of home equity, as consistent payments reduce your loan balance. If you're considering refinancing, adjusting refinance rates or exploring options, visualizing your mortgage’s trajectory aids in making informed decisions about how changing terms can affect your financial goals. By adding extra principal payments, you accelerate the reduction of your balance, shortening your loan term and lowering interest costs. This comprehensive view allows you to strategize effectively, whether you prioritize paying off the loan early or comparing potential scenarios. Ultimately, understanding how your mortgage unfolds over time empowers you to manage your financial responsibilities efficiently, leveraging each payment to build equity or plan strategically. Use these insights to enhance the benefits of your home financing decision-making through informed analysis over the full life of your mortgage.
Factors Influencing Your Mortgage Loan
When considering a mortgage loan, several critical factors come into play, impacting both your monthly payments and overall financial strategy. The interest rate is among the most significant determinants, with even slight fluctuations affecting how much you'll pay over the loan term. Lenders set these rates based on various market conditions and borrower profiles. The loan amount and the length of your loan term also play crucial roles. A longer term might lower monthly payments but generally increases the total interest paid over time. Conversely, shorter loan terms often result in higher monthly payments but reduce the long-term cost of interest. Refinance options allow you to adjust your loan to take advantage of lower refinance rates, which could lower your ongoing payment and interest cost. Over time, as you make payments, the portion applied to the principal increases, gradually enhancing your home equity. Understanding these factors can empower you to choose wisely and potentially save significantly. Strategies involving additional principal payments can further reduce time and interest costs. With the right insights and tools, like the Mortgage Payment Calculator, managing your loan efficiently for maximum benefit becomes entirely feasible.
The Role of Interest Rate and Loan Term
The interest rate and loan term are crucial factors that determine your mortgage's cost and duration. Interest rates represent the percentage of the mortgage loan's balance you pay in interest annually, while the loan term is the number of years over which you'll repay it. When interest rates are low, your mortgage payment decreases, making loans more affordable. Conversely, high rates increase monthly payments, raising the loan's total cost. Meanwhile, the loan term, whether 15, 20, or 30 years, significantly affects your mortgage payment and the total interest paid. Shorter loan terms typically involve higher payments but lead to substantial savings on interest over time, helping build equity faster. Longer terms reduce monthly payments, but you'll pay more in interest. Your mortgage's amortization schedule breaks down each payment, showing precisely how much goes toward principal and interest. Choosing the right combination of interest rate and loan term helps balance your financial goals. Use the Mortgage Payment Calculator to analyze how different rates and terms affect your mortgage loan, allowing you to make informed decisions and manage your home financing effectively. Make sure to consider rate changes over time as they can impact your mortgage payment dynamics.
Impact of Principal Payments
Making additional principal payments on your mortgage can significantly affect the total cost of your loan and your financial future. When you pay extra toward your loan principal, you reduce the balance faster, which decreases the interest charged over the loan term. Each extra payment you apply directly to the principal helps determine the decrease in interest costs. A lower principal means less interest accrues, because interest is calculated on the remaining balance, thus, each payment made on schedule allocates more toward the principal and less toward interest. This strategy can expedite your goal to build home equity and pay off your loan in fewer years. The impact of principal payments is especially noticeable when interest rates are high. If you're considering refinancing, knowing how extra payments affect your mortgage dynamics can help you evaluate refinance rates and options effectively. Employing a mortgage amortization calculator like ours at Mortgage Payment Calculator allows you to simulate various scenarios, making it easier to understand the real impact on your mortgage payment schedule. Whether you're considering refinancing the loan or just optimizing your payments, understanding the influence of principal payments empowers you to make informed financial decisions.
Strategies for Managing Your Loan
Effective management of your mortgage is key to maximizing home equity and optimizing financial health. When looking at the loan amount, an amortization calculator becomes an essential tool. It helps you clearly understand each payment, letting you see how much goes toward principal versus interest over time. By closely analyzing the schedule, you can strategize to refinance at lower refinance rates, potentially reducing overall debt. A vital aspect to consider is the loan term, with shorter terms often lowering interest costs and building equity faster. Refinancing might be a smart move if current refinance rates are favorable, allowing you to negotiate a more affordable monthly payment or decrease the loan term. Monitoring your mortgage balance regularly, utilizing the amortization calculator, enables proactive financial planning. Making extra principal payments can expedite the payoff process and decrease interest paid over the life of the loan. Adjusting your payment strategies can significantly impact your overall debt obligations and timelines. Ultimately, understanding and managing your mortgage effectively involves comprehensively considering your loan amount, term, and principal payment strategies to ensure long-term success and stability. With the right tools and a thoughtful approach, you'll be well-equipped to navigate the complexities of home financing.
Benefits of Paying Extra Principal
Paying extra principal on your mortgage can significantly enhance your financial position over the life of your loan. By directing additional funds towards your loan principal, you can reduce the total amount of interest you'll pay, as each dollar you pay lessens what your interest rate typically compounds against. This means more of your monthly mortgage payment goes toward reducing your loan amount rather than just covering interest. As a result, you'll build home equity faster, providing more flexibility and potential financial security. Using an amortization calculator, you can visualize how these additional payments impact your mortgage schedule, making clear how much time and money you can save. In conjunction with insights from this tool, examine how varying amounts of extra principal payments affect equity accumulation and allow for quicker loan payoff. With this strategy, not only do you potentially cut years off your mortgage term, but you also protect against fluctuations in your interest rate, preserving more of your equity. Consequently, you might open opportunities for earlier refinancing or selling options. Evaluate carefully, as modest additional payments can progressively ease the financial burden, enabling you to manage your mortgage more strategically.
Comparing Different Loan Scenarios
When navigating the complexities of home financing, it's crucial to compare different loan scenarios using a reliable mortgage calculator. By inputting various interest rates and loan terms, you can visualize how refinance rates and loan structures impact your payments and equity growth over the years. Every detail, from interest rate variations to extra principal contributions, plays a significant role in shaping the financial trajectory of your home loan. For instance, comparing a 15-year mortgage with a 30-year mortgage helps you understand how each payment affects your principal balance sooner and reduces overall interest costs. Mortgage calculators make it easier to compare different scenarios, aiding borrowers in making informed decisions. Suppose you're contemplating a refinance; assess how potential lower rates could alter the balance between interest and equity in your home over time. By analyzing these scenarios, you can determine the most advantageous rate, term, and payment scheme that aligns with your financial goals. Equipped with insights from the mortgage calculator, you can strategically manage loans, optimize home equity, and plan effective extra principal payments to reduce long-term costs. Use these comparisons to chart a path toward impactful financial outcomes.
Unlock financial clarity with our free Mortgage Amortization Calculator. Whether you're a first-time buyer or a seasoned real estate investor, understanding your payment schedule, principal allocation, and interest costs is crucial. Use this tool to develop effective loan payoff strategies, explore refinancing options, and visualize the effects of extra principal payments. Equip yourself with the insights needed to manage your mortgage intelligently and confidently. By analyzing your amortization schedule, you can make informed decisions that align with your financial goals, ensuring a secure and optimized path to home ownership.
Frequently asked questions
Can I switch to bi-weekly payments?
Many lenders allow bi-weekly drafts. Our tool simulates this by adding about one extra monthly installment per year. Confirm fees and rules with your servicer.
Do taxes and insurance change?
They often change annually. For planning, we use level monthly averages so you can compare scenarios.
Will my real amount due equal the first P&I shown?
With fixed-rate loans, the principal-and-interest portion stays constant unless you refinance or recast. Escrows and extra contributions can change your total cash outlay.